Bible Reading Challenge System - Updated!
This post is in reference to a previous project that I have developed much further from where it originated.
As the yearly Bible reading challenge came to a close (congratulations to those college students who finished the New Testament!), the gears in my head started turning on how this project could be taken to another level. On the one hand, the system worked flawlessly. On the other hand, I started to wonder whether I could use the same codebase and database to help other Christian clubs that we partner with around the Midwest. There was a lot of room for improvement in both the architecture of the site, as well as some quality of life features and statistical analysis diagrams that could be generated with all the data the site collects. This post will cover those two items.
Multiple Sites
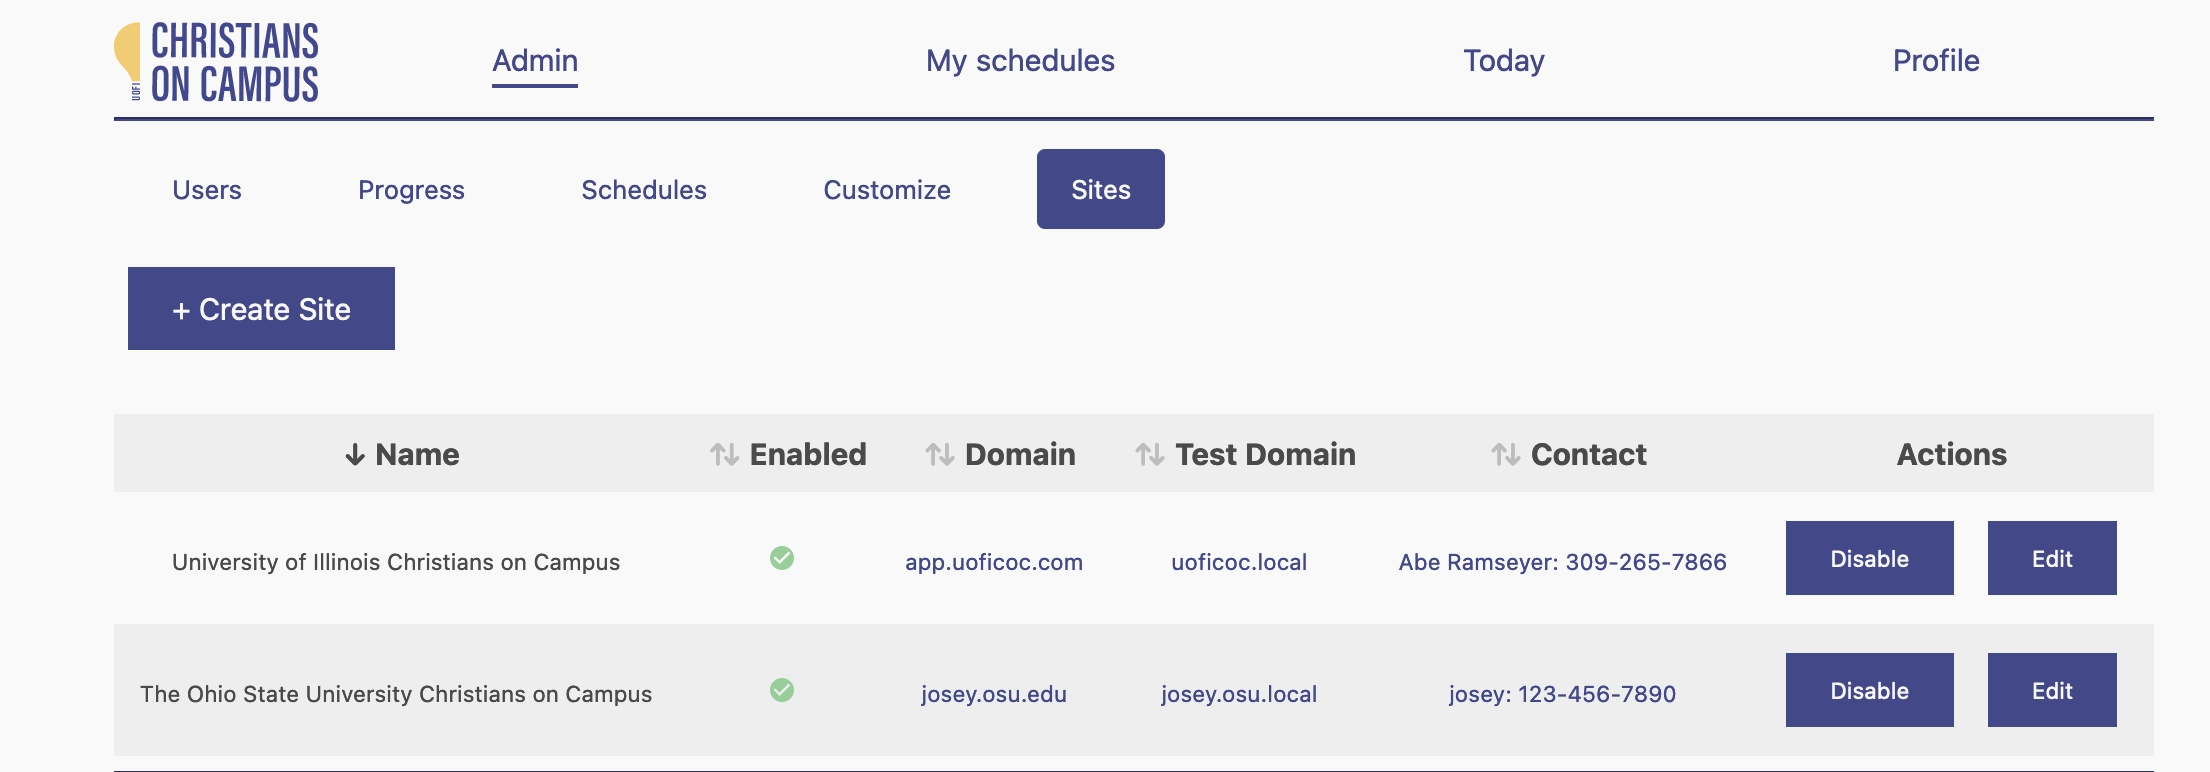
The intention of this project was to host the same website for multiple groups, all using the same system, server, database, etc. With no confidential data, segregation of the data was not a concern. All of the details specific to the group I was developing this site for were hardcoded into the application, so the first step was to find all the places where branding existed and put those into a new table in the database. Colors, titles, names, labels, photos, all needed to user-customizable.
This required a huge amount of code refactoring to put everything into a centralized, fully-customizable repository. Notably, at the end of the customization page is a place to specify the domain names of the site. When everything is set up and activated (including setting specifying certain environment variables and API keys for each site), the website will be active for the domain that points this server. In the process of setting up a new microsite, I would be in contact with them to get their API keys and domain names. It would only be their responsibility to add the correct DNS records and then customize all the details to their liking.
User uploads
The way I decided to manage this was as follows:
- Users upload any number of photos through the interface. Target dimensions are provided for the user as “optimal.”
- Files are saved in a local directory outside of the publicly available web directory
- When a photo is activated in any of the categories (favico, logo, progress image, login page, etc.), the uploaded photo is copied to the publicy available directory
- Any unused photo is deleted out of it
Maximum file size and duplicate checks prevent wasting space.
Statistics
Statistics have been sprinkled in gradually as I developed the site. First the site merely indicated what days a user had read that week. Then there was a graph for how many days each user read over the four weeks. Then I added word counts for individual users and the entire club. Then there was percentage-complete indicators of the challenge on a word-level basis. This went on for some time.
The first graphs I implemented were a super primitive graph that was drawn in a few dozen lines of javascript to a canvas. As things became more complex, I opted to go for the ChartJS library instead, as my needs were growing for the charts.
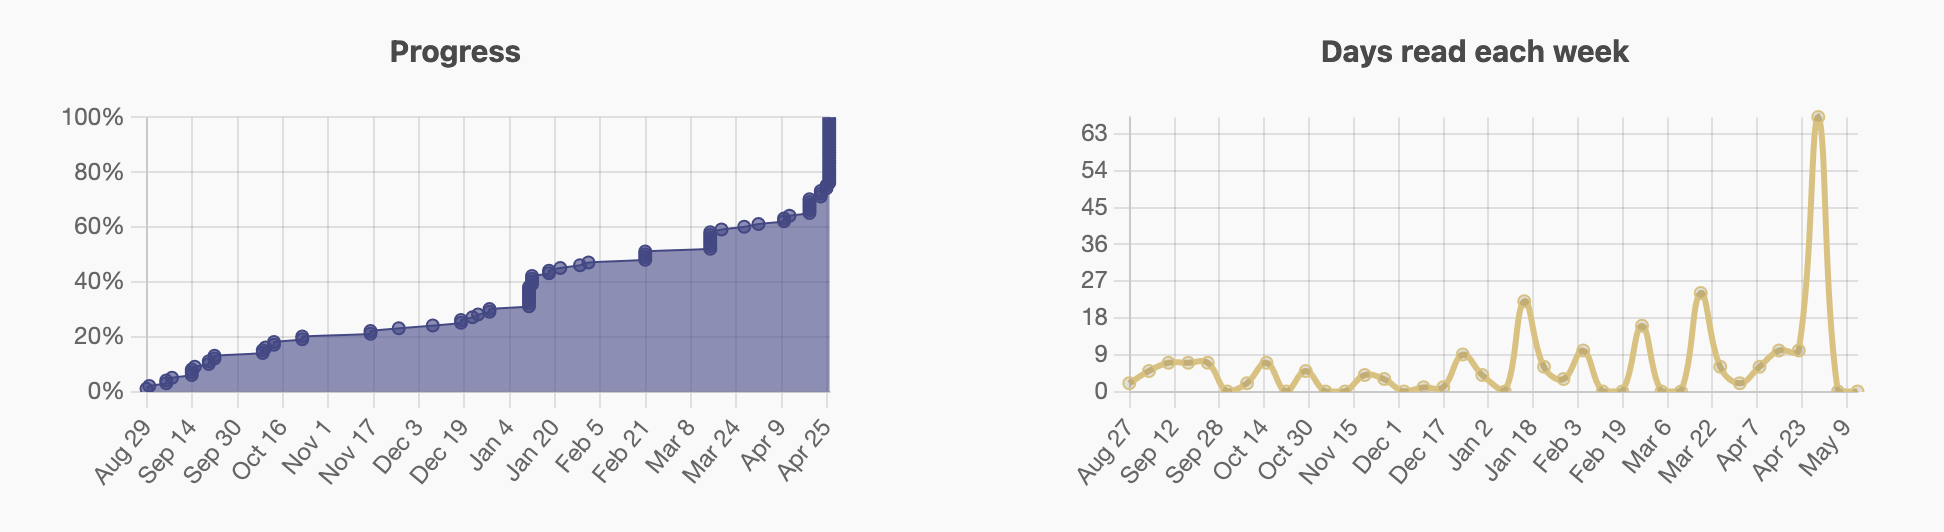 Ultimately, we ended up with these two graphs for every user. More may come in the future.
Custom graphics
On a club-wide scale, it’s good to see how each member measures up against the total. Also, as an individual user, it’s encouraging to see how others are doing at keeping up with the challenge to read every day. For that purpose, this graphic was created. It’s significance is specific to the club and is not important.
Each user can specify an emoji to represent himself. This is used in the real-time presence indication, and now also in this progress graphic. For our mountain, the emojis traveled from bottom to top as each reader’s completion percentage increases throughout the year.
For an overall perspective and feel of the club’s progress historically, the site generates a graphic with the progress of the users over each month:
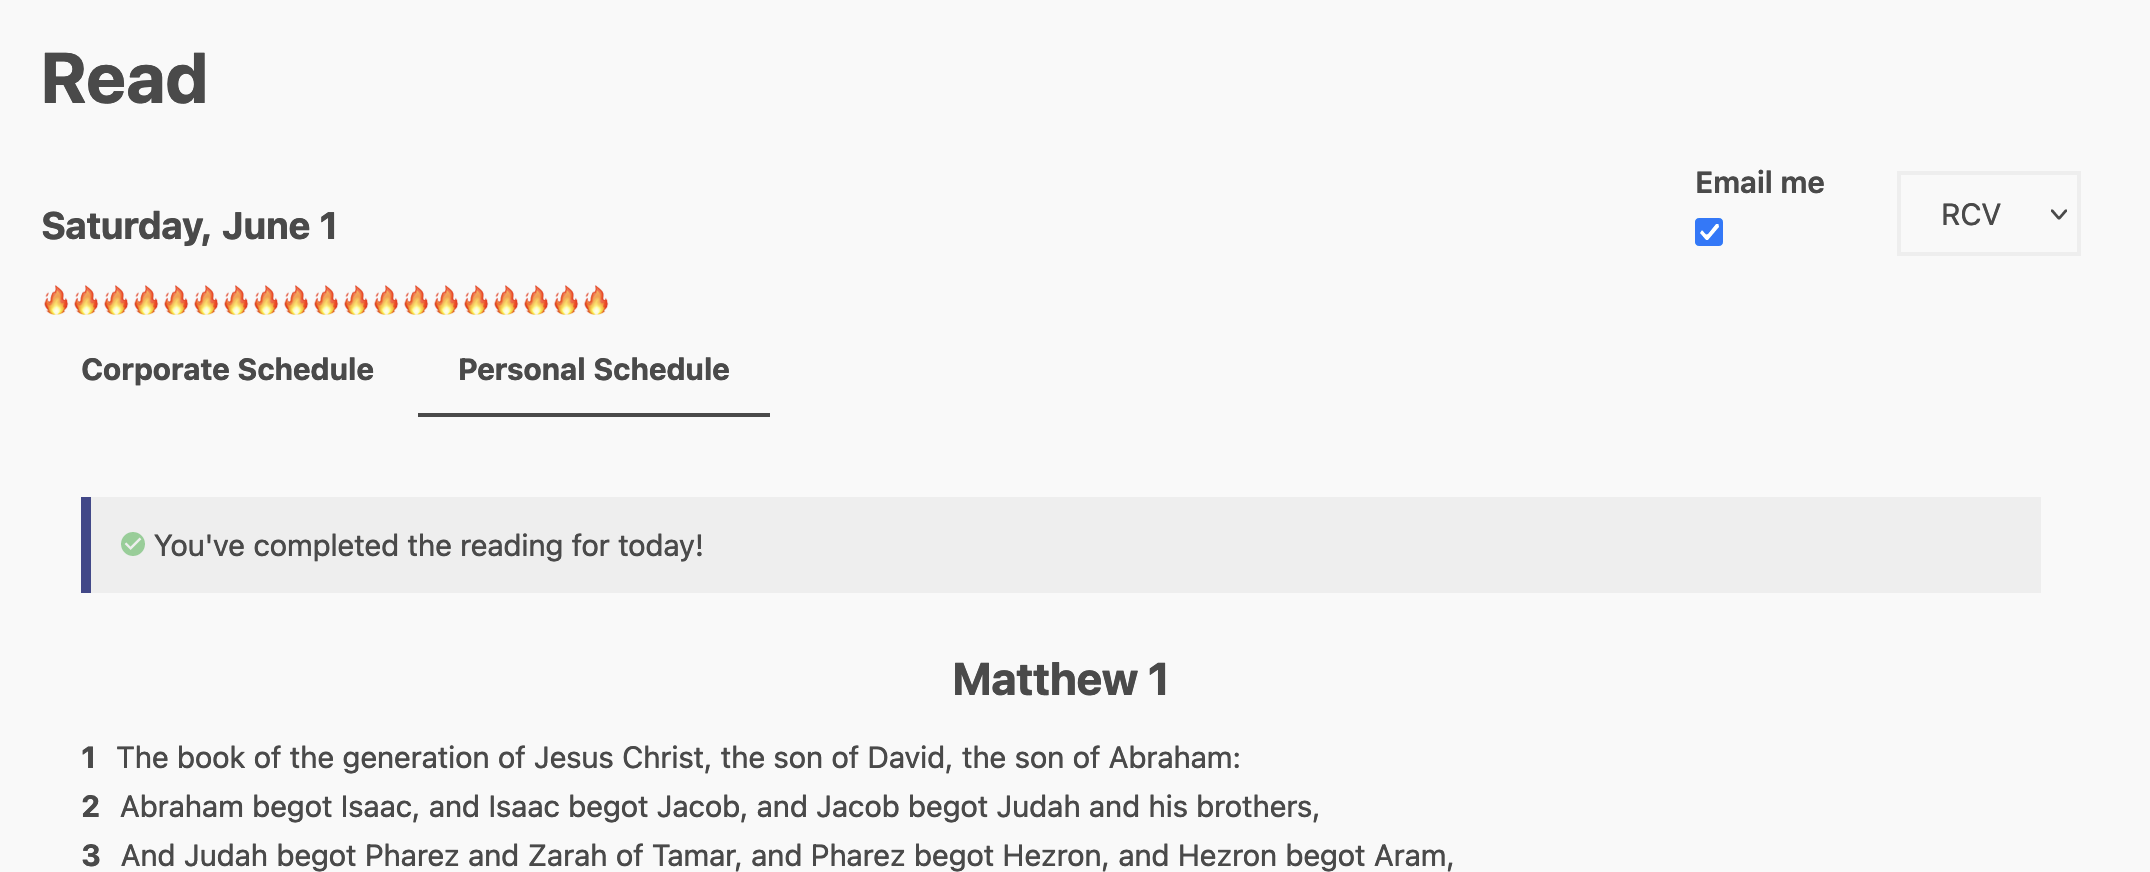
Personal Schedules
Many readers of the Bible already have a schedule that they follow throughout the year. This site is mainly for new readers who need a communal way to encourage one another and track their progress, but I also did not want to exclude those who already maintain a good habit of reading regularly. To that end, I decided that a site could optionally enable users to create their own schedules. This required another large refactor of the website, but not as big as the initial one to allow for multiple microsites.
Personal schedules are displayed alongside the group schedule, and can be individually personalized to read as much or as little as desired. They are not emailed with the corporate schedule, and do not count toward overall progress of the challenge, but they do increase a user’s personal statistics and count toward the earning of badges.